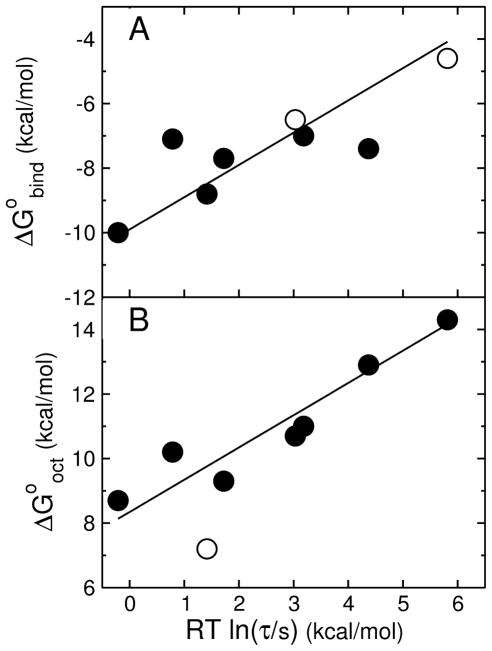
FIGURE 7.
(A) Gibbs energy of binding to the membrane interface determined experimentally ( ) as a function of the mean characteristic time τ for CF release from POPC LUV. Each point corresponds to a peptide: TP10W and its mutants TPW-1, TPW-2, and TPW-3; TP10, the C-terminal carboxylate versions TP10-COO− and TP10W-COO−, and the fluorophore-modified TP10-7MC (8, 15). The solid symbols correspond to entirely experimental data, both for binding and dye release. The open symbols correspond to TP10 and TP10-COO−, for which τ is experimental but the binding affinity is calculated with the Wimley-White scale (neither contains Trp). The line is a fit with a slope of 1. (B) Gibbs energy of transfer to octanol calculated with the Wimley-White scale ( ) as a function of the mean characteristic time τ for CF release from POPC LUV. The points correspond to the same peptides as in (A). The open symbol corresponds to TP10-7MC for which is an estimate assuming a replacement of the modified Lys by Tyr, which gave good agreement with when used to calculate for binding using the Wimley-White interfacial scale. The line is a fit with a slope of 1 (excluding the TP10-7MC point).

