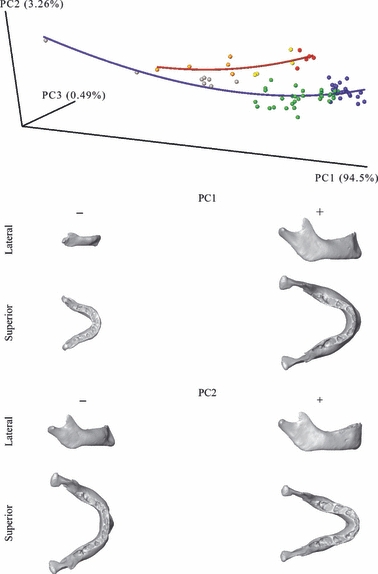
Fig. 4.

Form-space principal component analysis. The first three components account for 98% of the total form-space variance. Surfaces correspond to the shapes represented by negative and positive extremes of PC1 and PC2. Line: blue, human ontogenetic trajectory of mandibular growth; red, chimpanzee ontogenetic trajectory of mandibular growth. Spheres: gray, human fetuses; green, humans at DS1; blue, humans at DS2; orange, chimpanzee fetuses; yellow, chimpanzees at DS1; red, chimpanzees at DS2.
