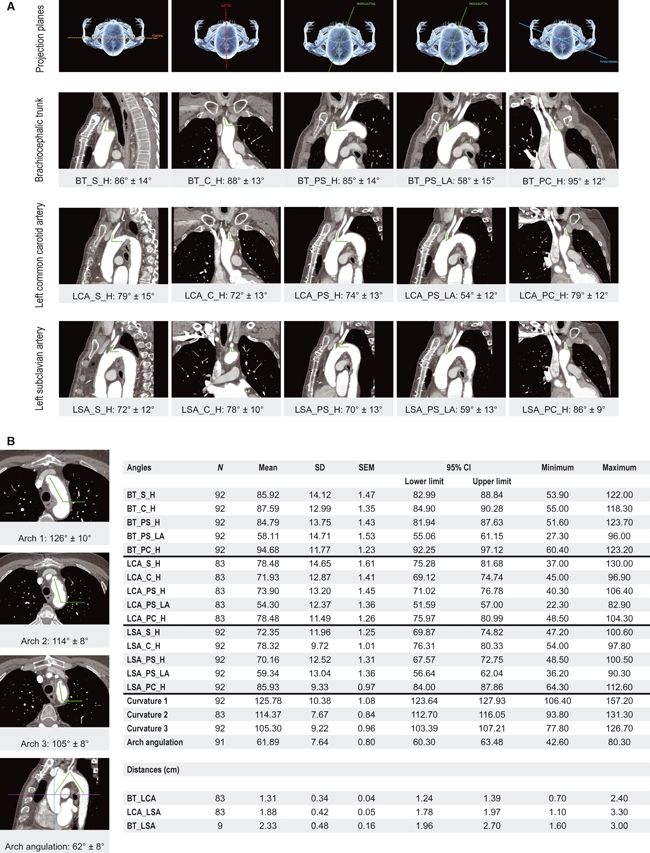
Fig. 4.

Graphical representation of all results. (A) First row indicates the respective projection planes and the three lower rows illustrate and group the means ± 1 SD of take-off angles of the three supra-aortic arteries in the respective projections. Supra-aortic arteries: BT, brachiocephalic trunk; LCA, left common carotid artery; LSA, left subclavian artery. Anatomical planes: S, sagittal; C, coronal; PS, parasagittal; PC, paracoronal. References for the angle measurements: H, horizontal; LA, long axis of the aortic arch. (B) Photographs illustrate the means ± 1 SD of the inclination of the three aortic arch segments and the aortic arch angulation. The embedded table summarizes the descriptive statistics of all measured parameters. CI, confidence interval.
