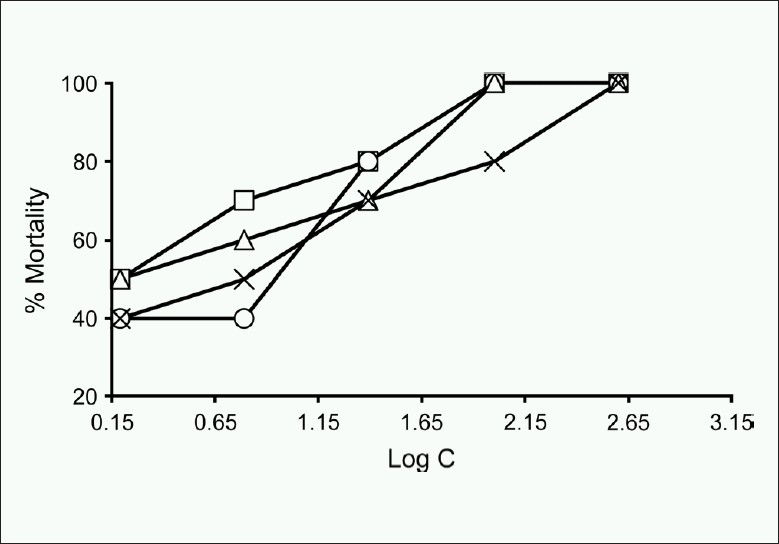
Figure 1.

Plot of log concentration of n-hexane (— □ —), carbon tetrachloride (— ○ —), chloroform (— ∆ —) and aqueous (— × —) fraction of methanolic extract versus percent shrimp mortality after 24 h of exposure

Plot of log concentration of n-hexane (— □ —), carbon tetrachloride (— ○ —), chloroform (— ∆ —) and aqueous (— × —) fraction of methanolic extract versus percent shrimp mortality after 24 h of exposure