Figure 3.
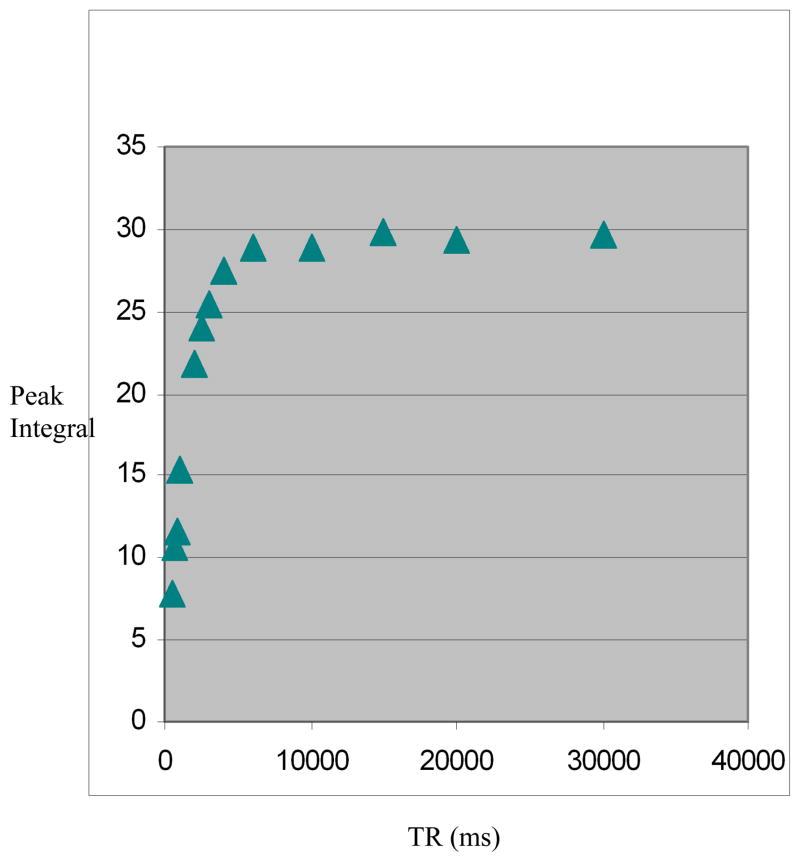
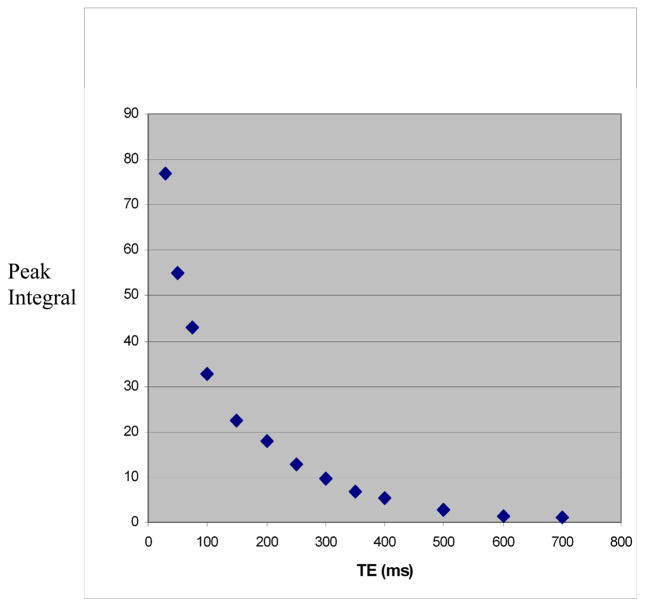
Measurement of T1 and T2 relaxation times of Cho in volunteer 2.
Figure 3a. Measurement of T1 relaxation time using TE 30 ms and numerous TRs between 500 ms and 30000 ms. The curve represents variations of the peak integral value of Cho as a function of TR.
Figure 3b. Figure 3b. Measurement of T2 relaxation time using TR 3000 ms and numerous TEs between 30 ms and 700 ms. The curve represents variations of the peak integral value of Cho as a function of TE.


