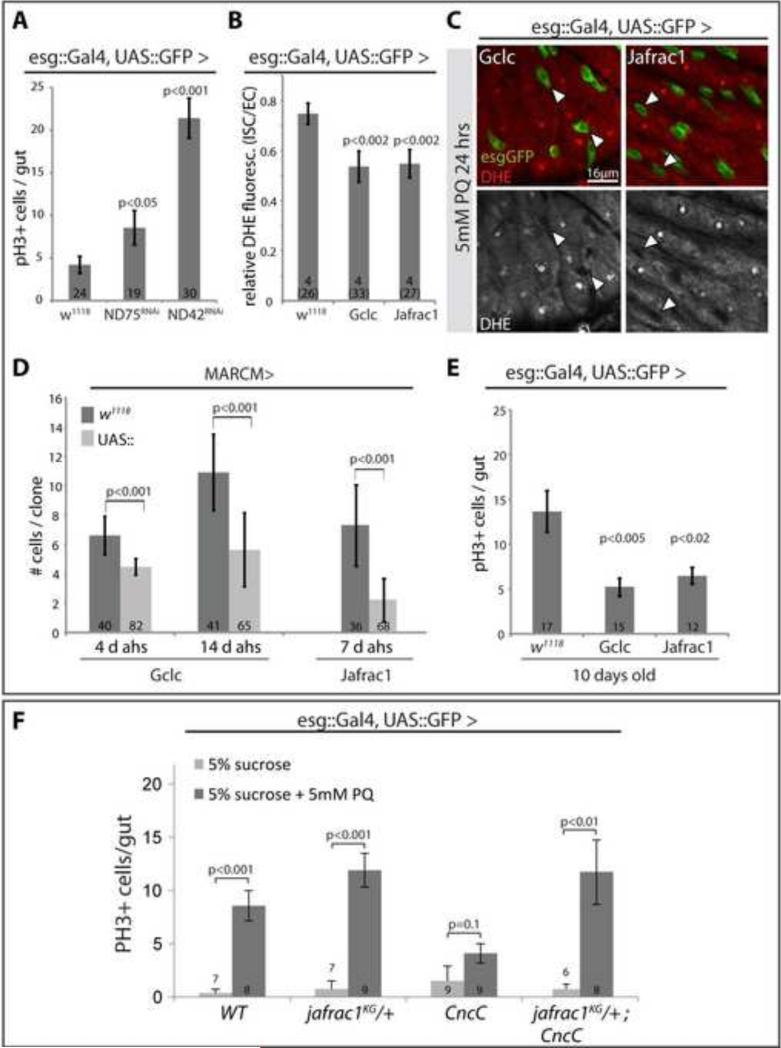
Figure 5. Regulation of ISC proliferation by modulating the intracellular redox state.
A: Increased ISC proliferation in response to loss of mitochondrial electron transport chain components (NADH:ubiquinone reductase 75kD and 42kD subunit precursors; ND75RNAi and ND42RNAi). PH3+ cells per gut are quantified (Average and SEM, Student's T-test, N in bars).
B, C: Representative images and quantification of DHE fluorescence in intestines over-expressing Gclc or Jafrac1 in ISCs (7 day old flies, Average and SEM, Student's T-test, N in bars; esgGFP, green; DHE, red).
D: Cell numbers in MARCM clones over-expressing Gclc or Jafrac1 quantified at 4 and 14 days, or at 7 days after heat shock (average cell numbers and standard deviations; Student's T-test).
E: Quantification of mitotic figures in intestines of 10 day-old flies over-expressing Gclc or Jafrac1 under the control of esgG4::UASGFP (Average and SEM, Student's T-test).
F: Cnc-mediated repression of ISC proliferation in response to Paraquat exposure requires jafrac1 gene function. CncC was over-expressed under the control of esgGal4 in wild-type or jafrac1KG05372 heterozygous backgrounds (Average and SEM, Student's T-test).
See also Figure S5.

