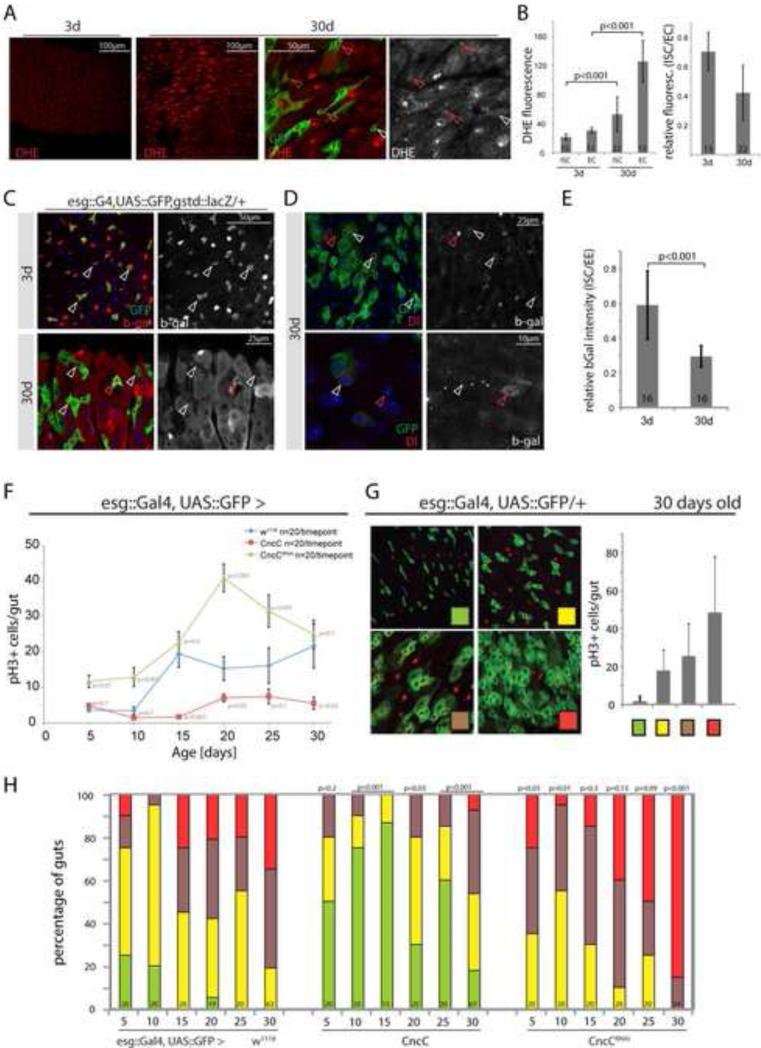
Figure 6. CncC/Nrf2 maintains intestinal homeostasis in aging flies.
A, B: Elevated ROS concentration in the intestinal epithelium of aging flies. Images (A) and quantification (B) of DHE fluorescence in intestines of young (3 day) and old (30 day) flies (DHE, red). Intestines were co-stained in the same well to ensure equal DHE staining, young and old guts were identified by GFP expression (3d: OreR, 30d: esg::G4;UAS::GFP; Average and standard deviation, Student's T-test, N in bars; GFP, green; DHE, red. Normalized fluorescence (ISC/EC ratio) is shown on the right. See Figure S7 for additional images.
C: Reporter activity in young (3 day) and old (30 day) flies (GFP, green; β-gal, red). gstD1::lacZ expression is reduced in most ISCs of old flies (white arrowheads). Infrequently, single esg-GFP+ cells expressing β-gal are detected (red arrowheads).
D: Reporter activity detected in 30-day-old flies counterstained with Dl antibody to identify ISCs (Dl, red, left panels; β-gal, red, right panels). White arrowheads point to ISCs for orientation, red arrowheads to EEs.
E: quantification of β-gal fluorescence intensity. As in D, ISCs detected as esg-GFP+, Dl+ cells. Average and standard deviation, Student's T-test, N in bars.
F: ISC proliferation in aging wild-type flies (esg::Gal4, UAS::GFP, blue) and in flies expressing CncC (red) or CncCRNAi (green) in ISCs and EBs. Flies were analyzed by counting PH3+ cells in the gut every 5 days. Data points represent averages +/- SEM.
G: Four categories based on the extent of accumulation of esg+ cell clusters used for quantification of intestinal degeneration (representative pictures). The four categories correlate with increasing numbers of PH3+ cells (graph on right).
H: Quantification of intestinal degeneration in aging flies (5-30 days of age) by blind scoring of individual intestines. In addition to containing fewer proliferating cells, guts with elevated levels of CncC in ISCs/EBs show significantly reduced intestinal degeneration compared to wild-types, whereas CncC knock-down in ISCs/EBs accelerates the progression of intestinal degeneration. P-values from Pearson χ2 test (compared to wild-types of same age), N shown in each bar.
See also Figure S6.

