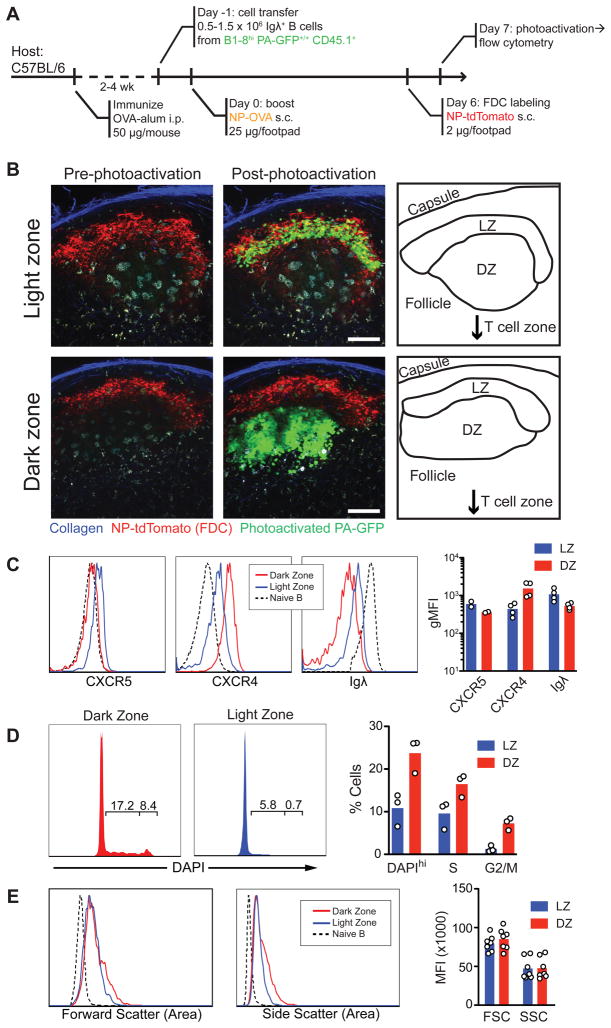
Figure 2. Phenotype of LZ and DZ cells.
(A) Diagrammatic representation of the experimental protocol.
(B) Examples of LZ (top row) and DZ (bottom row) multiphoton photoactivation. Collapsed Z-stacks (40 μm, 5 μm steps). Scale bar = 50 μm. Imaged at λ=940 nm before and after photoactivation at λ=830 nm.
(C–E) Chemokine receptor and BCR expression, DNA content (DAPI), and forward and side scatter in photoactivated LZ or DZ cells. GC cells gated as live/single, CD45.1+, FAShi. Non-GC cells (shown for comparison) gated as Igλ+FAS− Left panels: quantification of flow cytometry data. Each symbol represents one experiment (pools of 3–5 mice per experiment).

