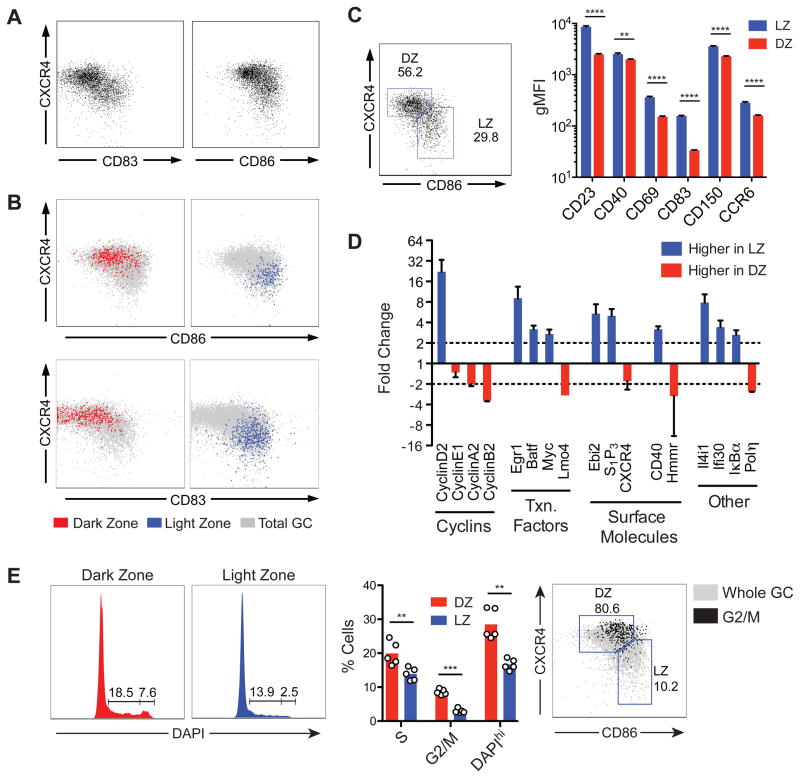
Figure 4. Distinguishing LZ and DZ cells by flow cytometry.
(A) Examples of distribution of GC cells according to expression of CXCR4 and CD83 or CD86 in day 7 secondary GCs generated as shown in Fig. 2A. Gated on B220+CD45.1+CD38−FAS+.
(B) Distribution of GC cells photoactivated in LZ or DZ according to expression of CXCR4 and CD86 or CD83. Gated on CD45.1+, FAShi, photoactivated PA-GFP+.
(C) Expression of surface markers in LZ and DZ gates by flow cytometry. Polyclonal GCs were generated in wild-type B6 mice as indicated in Fig. S3A, and LZ and DZ populations were defined by expression of CD86 and CXCR4, as shown in the left panel. Right panel, expression of surface markers in LZ and DZ gates. Histograms are presented in Fig. S3B. Representative of 2–3 independent experiments with 2–3 mice each. Error bars represent SEM.
(D) Confirmation of microarray results by qPCR. LZ and DZ cells sorted according to expression of CD86 and CXCR4. GCs generated as in Fig. S3A. Sorting strategy and post-sort purity are shown in Fig. S3C. Graph represents data from two experiments with pools of 10 mice each. Error bars represent SEM.
(E) Cell cycle analysis by DNA content of LZ and DZ cells gated according to expression of CD86 and CXCR4. Left panel, DAPI profiles of cells in LZ and DZ gates. Middle panel, quantification of data from two independent experiments; each symbol represents one mouse. Right panel, cells in G2/M concentrate in the DZ gate. Percentages refer to G2/M cells.
** p < 0.01; *** p < 0.001; **** p < 0.0001, paired T test. Bars = standard error of mean.

