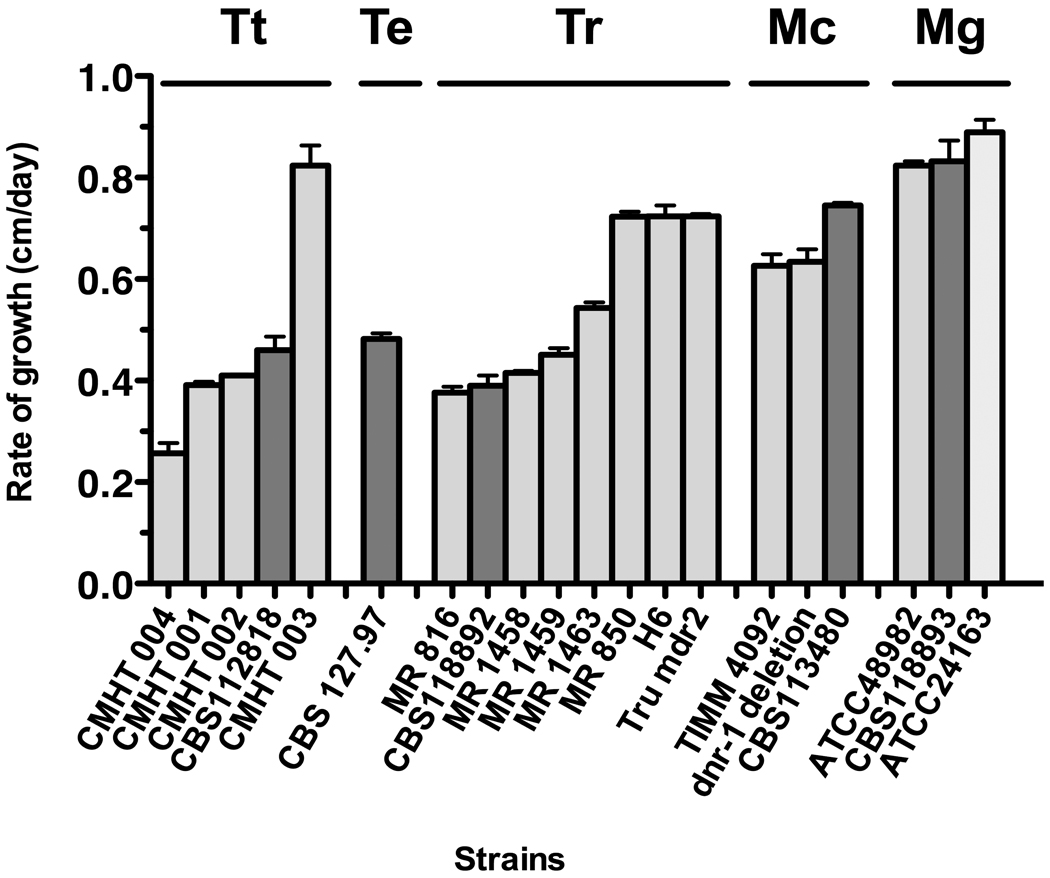
Figure 2. Growth rates of 20 strains.
The growth rates of 20 strains (Table 1), including the 5 sequenced strains, were calculated for days 2 to 5, during which time the rates were linear over time, without reaching the outside of the petri plate. The rates are expressed as cm/day. The strains are grouped into species: T. tonsurans (Tt); T. equinum (Te), T. rubrum (Tr), M canis (Mc) and M. gypseum (Mg). Results are the average of three independent experiments with standard deviations. The darker bars in each species are the sequenced strain.

