Fig. 2.
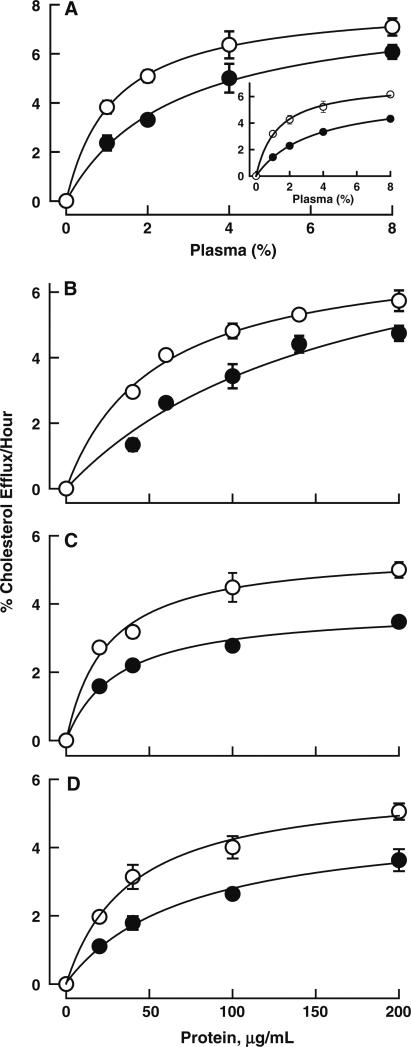
[3H]Cholesterol efflux from THP-1 macrophages to various acceptors. The acceptors were plasma (a), TLP (b), and HDL (c) each with (open circles) and without (closed circles) preincubation with rSOF for 18 h. Efflux to isolated HDL (closed circles) and neo HDL formed from rSOF + HDL (open circles) is shown in (d). Insert in a shows efflux from cholesterol-loaded macrophages to plasma. Other details are in “Materials” and Fig. 1. Two-way ANOVA analysis of the regression plots indicated that rSOF pretreatment significantly increased efflux to all of the acceptors (p < 0.001), and Bonferroni post tests indicated this was true for all the concentrations tested (p < 0.01)

