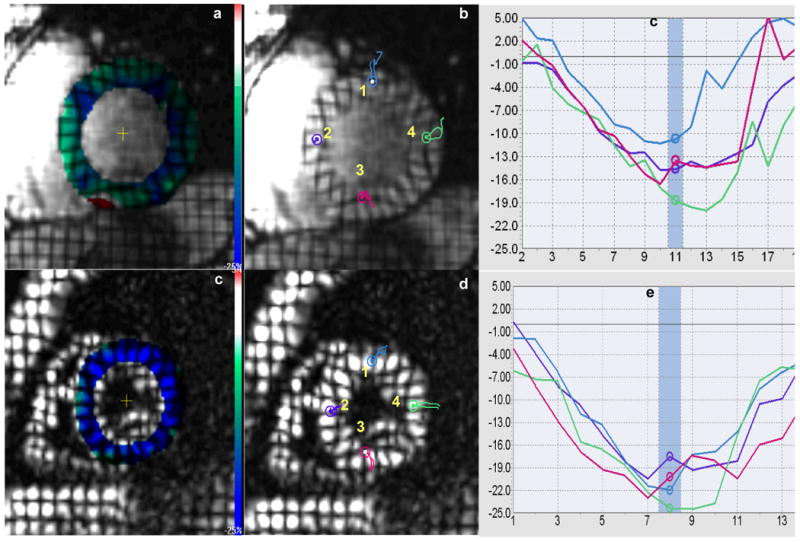
Figure 1.

Figures a and d show color-coded maps superimposed on tagged MR short-axis images from one patient with definite ARVD and healthy control. Bar color demonstrates the spectrum in change of cardiac systolic function: blue color identifies normal contractile state and red color represents dysfunctional areas. The green-dominant myocardium of the ARVD patient indicates generalized weaker systolic function in contrast to the blue-dominant myocardium in the healthy control. Figures b and e show colored probe points inserted each at 1) anterior wall 2) septal wall 3) inferior wall and 4) lateral wall in the patient and control, with figures c and f depicting midwall Ecc plots at the corresponding points. Note decreased Ecc in all four walls in the ARVD patient as compared to the control.
