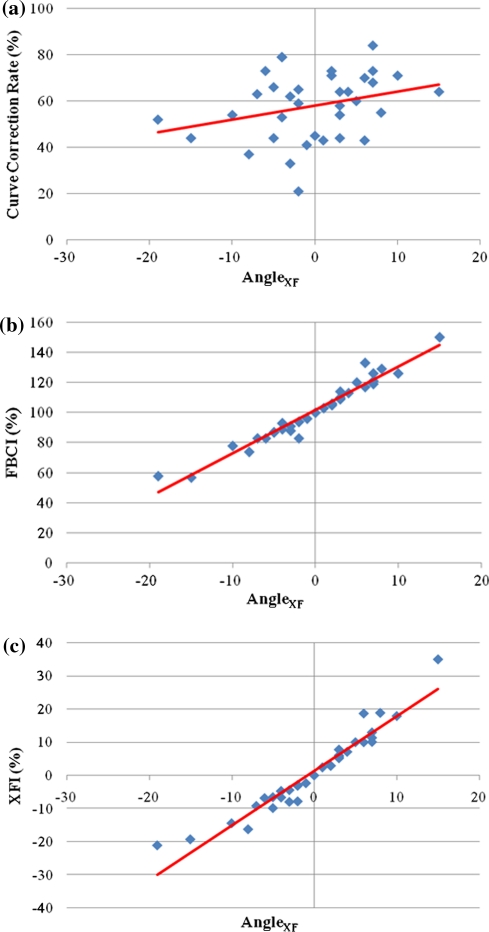
Fig. 3.
Scatterplot distribution of the angle contributed by “X-Factors” (AngleXF) to the (a) curve correction rate, the (b) fulcrum bending correction index (FBCI) and the (c) X-Factor Index (XFI). The greater the deviation of the plotted points from the straight linear trend line, the decrease in association between the two variables

