
Fig. 3. Edn1 regulates Alcama levels.
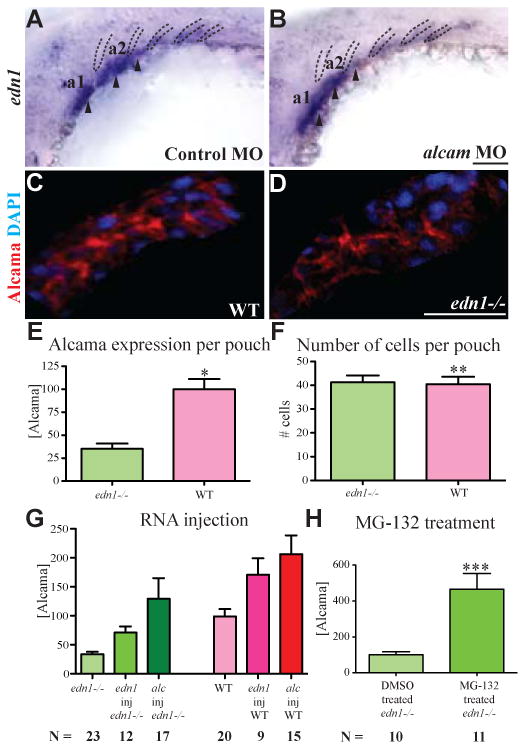
edn1 is expressed in the mesodermal cores (arrowheads) of the first 3 arches and in pharyngeal pouches 2-4 (dotted lines) (A). Its expression is unchanged in alcama morphants (B). Cropped image of a single pharyngeal pouch from 30 hpf WT sibling (C) and edn1-/- mutant (D) stained with Zn-5 (anti-Alcama) antibody in red and DAPI in blue. (E) Bar graph showing the difference in total Alcama protein in a pouch (second or third pouch), represented as measured fluorescence intensity normalized to WT; *p-value <0.0001 by a two-tailed t-test. The bar graph in (F) shows the total number of cells per pouch is unchanged in WT and edn1-/- mutants; **pvalue = 0.08495 by a two-tailed t-test. n=14 for WT; n=11 for edn1-/- mutants for this experiment which was repeated with similar results. (G) edn1 regulates the Alcama levels in pouches. The bar graph shows the sum of Alcama intensity in the first three pouches of 30 hpf edn1-/- (green) and WT (red) larvae after the indicated injections (p-value <0.0001 by one way analysis of variance). (H) Bar graph showing the sum of Alcama intensity in the first three pouches of 30 hpf edn1-/- larvae after treatment with DMSO or the proteasome inhibitor MG-132; ***p-value = 0.0009 by a two-tailed t-test. N is the number of larvae in a single experiment, which was repeated with similar results. a1 and a2 label pharyngeal arches 1 and 2. Scale bars: 50 μm.