
Figure 6. Effects of various lesions on vestibular-mediated response patterns in ipsilateral MNs.
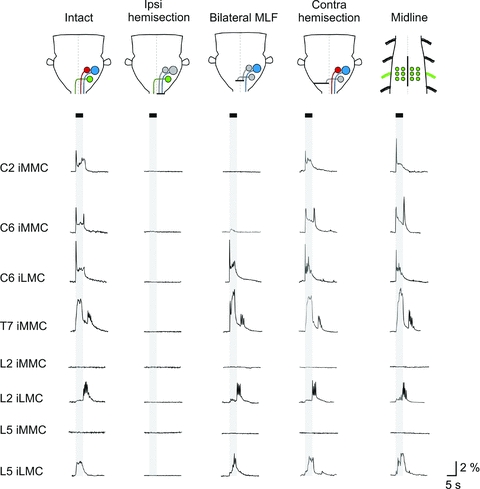
From top to bottom, traces showing the averaged response (n= 6 MNs) evoked in ipsilateral MNs in each of the segments studied. Each trace represents data from an individual experiment. The first and third columns show the typical responses in intact preparations and preparations with a bilateral MLF lesion, respectively (C2 and C6 from P2 mice, T7 from a P1 and a P4 mouse, L2 from a P3 and a P2 mouse and L5 from P3 mice). The second column (ipsilateral hemisection) and the last two columns (contralateral hemisection and midline spinal cord lesion) are from different experiments (ipsilateral hemisection: C2, C6, T7, L2 and L5 from P2 mice, contralateral hemisection: C2 from a P2 mouse, C6 from a P3 mouse, T7 and L2 from P1 mice and L2 from a P2 mouse, midline lesion: C2, C6, T7, L2 and L5 from P3 mice). The contralateral hemisections were performed either at the level of the obex (C2 and C6) or at C1 (T7, L2 and L5).