
Figure 9. Effects of lesions that sever most reticulospinal projections on vestibular nerve-evoked responses in spinal MNs.
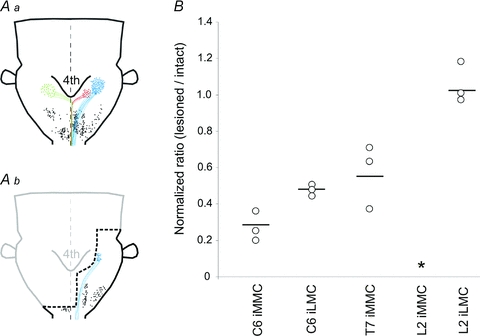
Aa and b, diagrams showing the distribution of retrogradely labelled neurons following application of RDA to ipsilateral VF + VLF at the level of C1. The distribution in Aa was plotted from an intact preparation (P2 mouse) and that in Ab from a preparation in which a broad transverse lesion of the brainstem was made (thick dashed black line, P2 mouse). iMVST, cMVST and LVST neurons are shown together with their axonal trajectories in red, green and blue, respectively, and reticulospinal and trigeminospinal neurons are shown as black dots. For the sake of clarity, each dot represents 1–3 retrogradely labelled neurons in the case of vestibulospinal neurons and 4–6 retrogradely labelled neurons in the case of the reticulospinal and trigeminospinal neurons. As shown, such a large brainstem lesion interrupted many descending connections including all contralateral projections, all iMVST projections, all medial reticulospinal projections and more than 50% of the LVST projections. Some of the ipsilateral projections including part of the LVST projection and all lateral reticulospinal and trigeminospinal projections were left intact. B, graph showing the normalized response ratios obtained by directly comparing the responses before and after the brainstem lesion in the same preparation. Each data point is from a single preparation and the horizontal lines indicate the grand mean.