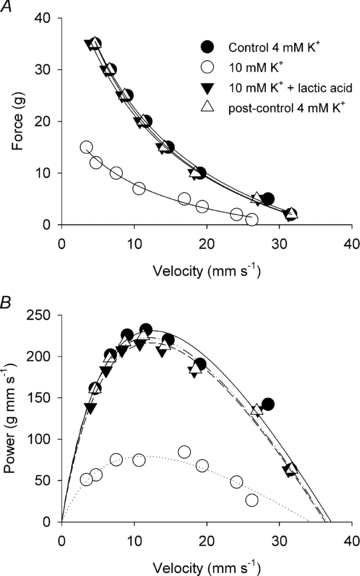
Figure 4. Effects of 10 mm K+ on FV curves and power–velocity curves in soleus muscles before and after addition of 20 mm lactic acid.

A, force–velocity curves fitted to data points from a representative muscle incubated at 4 mm K+ (control), 10 mm K+, 10 mm K+ with 20 mm lactic acid, and finally at 4 mm K+ again (post control). B, same data as above expressed as power versus velocity and fitted to power–velocity curves using the parameters obtained from the Hill fits in the top panel.
