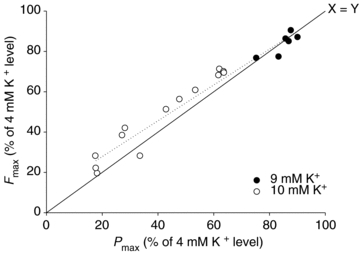
Figure 6. Relation between Pmax and Fmax in soleus muscles incubated at 9 or 10 mm K+.

Data points from 18 individual muscles incubated at high K+ are plotted as a percentage of control levels obtained at 4 mm K+. Dotted line represents best linear fit of the data points (r= 0.98).
