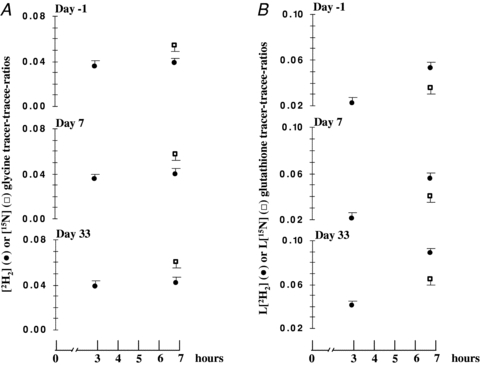
Figure 3. Enrichments of isotopic tracers and products before, during and after bed rest in red blood cells.

Red blood cells enrichments of isotopic tracers ([2H2] and [15N]glycine) and products ([2H2] and l-[15N]glutathione). A, steady state for [2H2]glycine (•) precursor pool is shown while steady state condition for [15N]glycine (□) pool is assumed. Diversity between tracer isotope steady state values is due to intrinsic metabolic differences between 2H2 and 15N isotopes. B, l-[2H2]glutathione (•) enrichment slope increase reflects linear tracer incorporation into glutathione products. Diversity between l-[2H2]glutathione and l-[15N]glutathione (□) product enrichments measured at the end of infusions (7th hour) is the result of different tracer incorporation times. [2H2]glycine was, in fact, infused for 7 h while [15N]glycine was infused for 3 h.
