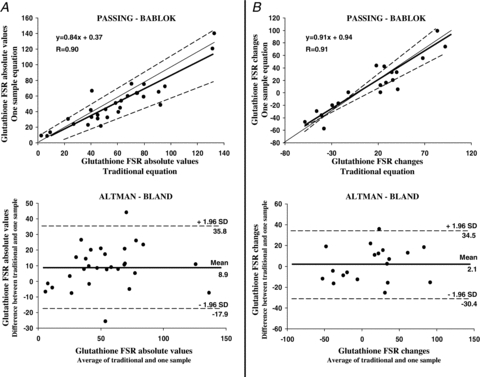
Figure 5. Method validation.

Traditional and one-sample approaches validation by Altman–Bland method and by analysis of linear regression of correlations by Passing–Bablok approach, applied to measurements of glutathione kinetics in erythrocytes. A, glutathione fractional synthesis rate (FSR) absolute values (% day−1) measured in red blood cells by ‘traditional’ and by ‘one-sample’ approach are in positive and significant (P < 0.001) linear correlation (Passing–Bablok plot, upper part) (n= 29). As evidenced in Table 1 slope and intercept are contained in their relative confidence intervals as analysed by Passing–Bablok test. Altman–Bland plot (lower part) of glutathione FSR absolute values shows only two measurements are outside the confidence interval and that data distribution across the mean can be considered as satisfactory. B, pooled changes of glutathione FSR (% day−1) from baseline to day 7 and to day 33 measured by ‘standard’ approach are in significant and positive (P < 0.001) linear correlation with analogous changes in glutathione FSR measured by the ‘one-sample’ approach (Passing–Bablok plot, upper part) (n= 19). As evidenced in Table 1, slope and intercept are contained in their relative confidence intervals as analysed by Passing–Bablok. An Altman–Bland plot of glutathione FSR changes shows only one measurement is outside the confidence interval and that data distribution across the mean can be considered as satisfactory. In Passing–Bablok plots regression lines are represented as continuous thick lines, identity lines (x=y) as continuous thin lines while limits of confidence intervals are dashed lines. In Altman–Bland plots the mean value line is represented by a continuous thick line while limits of confidence intervals are dashed lines.
