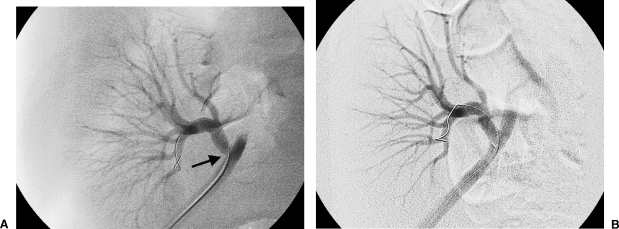
Figure 5.
(A) Prior to angiography, ultrasonography demonstrated a velocity of 6 m/sec at the external iliac artery–renal artery anastomosis. Gadolinium angiogram confirms stenosis (arrow) in this location. (B) Following angioplasty with an 8-mm balloon catheter, the pressure gradient dropped from 54 mm Hg to less than 10 mm Hg.

