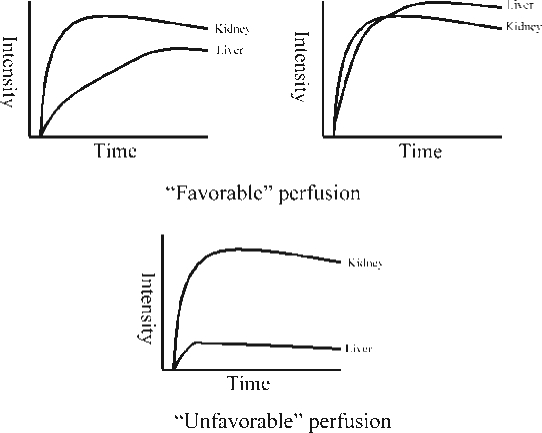
Figure 2.
Schematic of kidney/liver perfusion curves. The upper two graphs illustrate patients with favorable perfusion curves, which are either retained portal-type perfusion (left) or arterially compensated flow with intensity values equal or higher to the kidney (right). The lower graph shows unfavorable perfusion with weak arterial flow patterns far below renal values.

