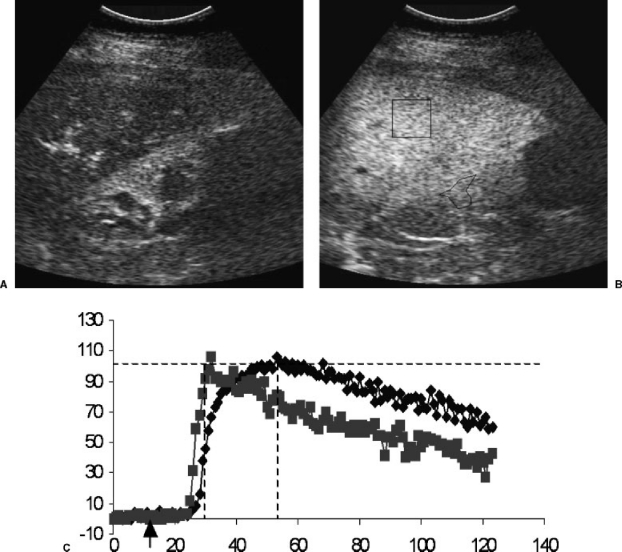
Figure 3.
(A) Longitudinal contrast-enhanced ultrasound image of the liver (top) and kidney (bottom) during the arterial phase. The renal parenchyma and hepatic peribiliary tissues are enhancing. (B) portal phase ultrasound images with regions of interest drawn for time-intensity curve generation. (C) Resulting perfusion curves for kidney (square points) and liver (diamond points) in a patient with a normal liver. Notice the steep arterial slope for the kidney and the more gradual slope and delayed plateau for the liver, which relies primarily on portal flow. x-axis, time in seconds; y-axis, signal intensity; arrow on x-axis, time of bolus intravenous injection of ultrasound contrast agent.

