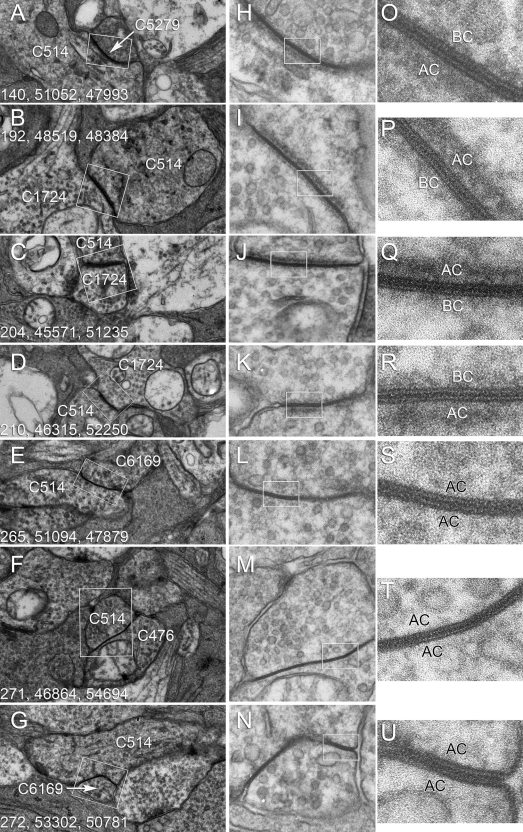
Figure 9.
Gap junctions between identified cells are visualized by transmission electron microscope (TEM) in the RC1 data set and after re-imaging at 0.3 nm resolution. Panels A-G are native Viking images showing putative gap junctions (box areas). Each panel is 3570 nm wide. The numbers denote the location of the image in the RC1 image volume (section number, x location, y location). Panels H-N are the same locations re-imaged at 40,000× on Kodak 4498 Electron Microscopy Film and digitized at 2540 dpi and 16-bits. Each panel is 602 nm wide. Panels O-U are validated gap junctions scaled from the boxed regions in H-N. Each panel is 150 nm wide.

