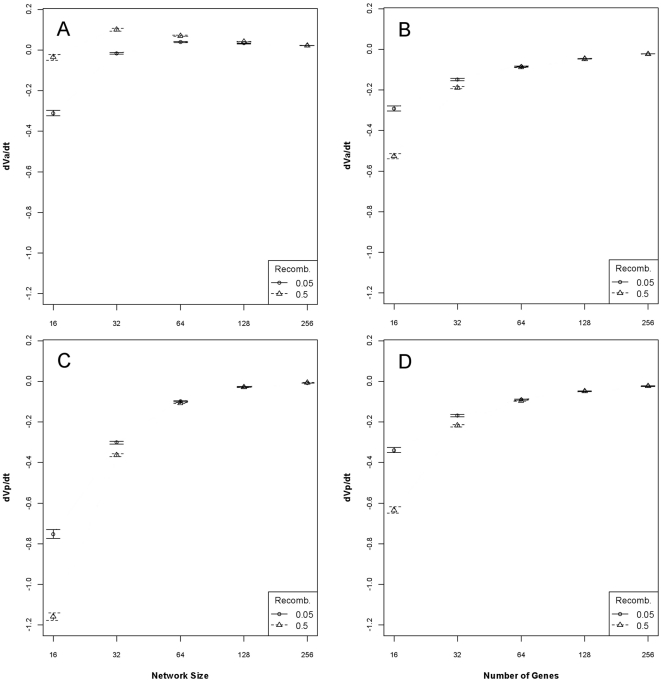
Figure 3. The rates of change of genotypic and phenotypic variance over 250 generations in a constant environment.
On the left, the mean (±95% CI) rate of change of additive genetic variance (dVA/dt; Panel A) and phenotypic variance (dVP/dt; Panel C), given a network genetic architecture, as a function of network size and recombination rate. On the right (Panels B and D), the same parameters given a linear genetic architecture. The results are generally consistent with the analytical solutions assuming additivity of Crow and Kimura [9] and Bürger [10].

