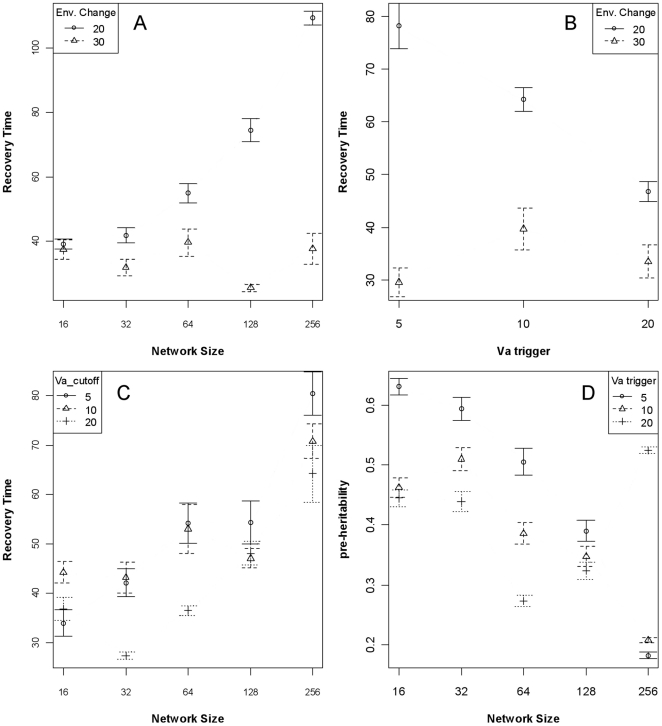
Figure 6. Recovery time (A-C) and pre-change heritability (D) when experimentally controlling for additive genetic variation.
When the environmental change is smaller (20 units), the relationship between network size and recovery time is clear, but when the impact is larger (30 units), the relationship is lost (Panel A). Panel B partitions recovery time between the additive genetic variance trigger (VA trigger) for the environmental change and degree of environmental change, demonstrating the effect of the environment with respect to the role of VA. Averaging over degrees of environmental change and considering recovery time as a function of network size and VA, the positive relationship between network size and recovery time is more apparent that solely considering the VA (Panel C). Panel D shows that, although there is an equivalent amount of additive variation present in the population for each network size, smaller networks tend to have higher pre-change heritability (i.e., pre-heritability) than larger networks.

