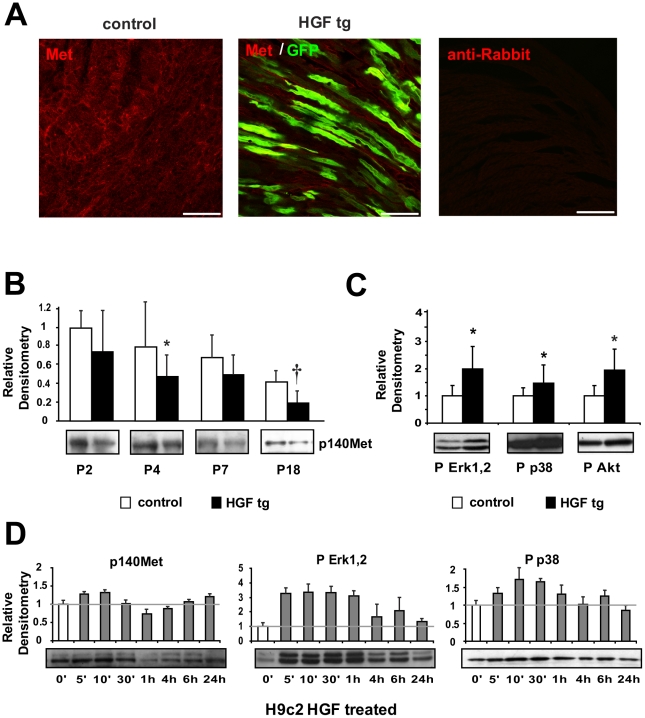
Figure 2. Analysis of Met expression and downstream signalling activation in neonatal cardiomyocytes.
(A) Immunofluorescence of Met receptor (red) and GFP (green) in neonatal (P7) heart samples of control (left panel) and HGF tg mice (middle panel). A negative control of secondary antibody was included (right panel). Bars: 50µm. (B) Western blot of Met (p140Met) protein in control and HGF tg mice at different ages post-birth (P2 n = 6 n = 7, P4 n = 8 n = 6, P7 n = 10 n = 11, P18 n = 9 n = 14). Representative blots are shown below densitometric quantification (normalized on GAPDH loading control, relative to P2 control). Controls vs HGF tg mice: *p<0.05 and †p<0.005 (two-tailed T-test). (C) Densitometric quantification (normalized on tubulin loading control) and representative Western blot of phospho-Erk1,2 (P Erk1,2), phospho-p38 MAPK (P p38) and phospho-Akt (P Akt) in HGF tg (n = 7) relative to control mice (n = 6) at two days post birth (P2). *p<0.05 (two-tailed T-test). (D) Western blot analysis of Met receptor and downstream signalling after treatment of H9c2 cardiomyoblast cell line with 10U/ml of HGF for different lengths of time. Densitometric quantification was normalized against tubulin and plotted as relative to time 0′ of treatment. Each condition was tested 3 times.

