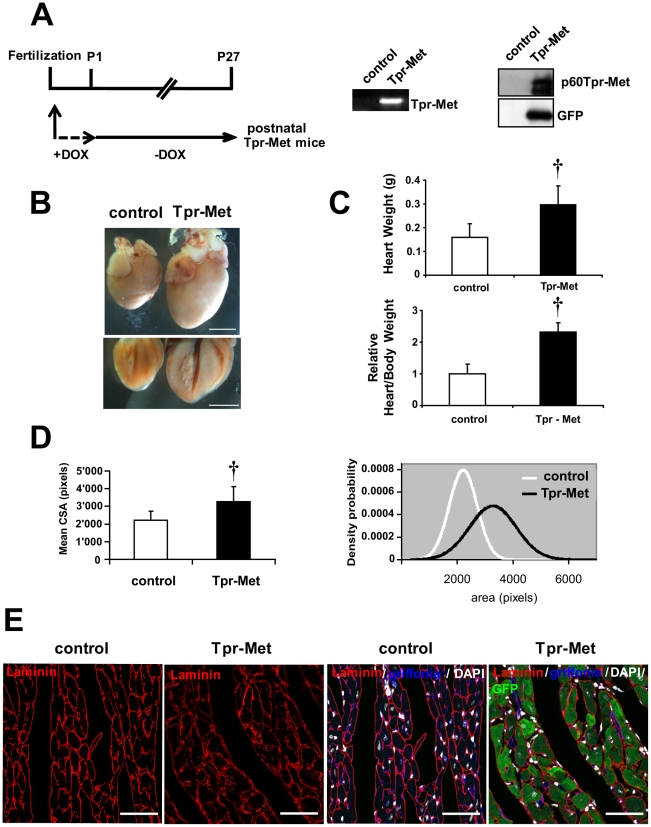
Figure 5. Induction of activated Met in postnatal cardiomyocytes leads to hypertrophy.
(A) Experimental design (left), RT-PCR (middle) and immunoblot (right) of Tpr-Met expression in postnatal Tpr-Met mice (P27) with Doxycycline (DOX) suppression until birth, compared to controls. (B) Control and postnatal Tpr-Met hearts were analyzed under stereomicroscopy for comparison (upper panel). Four-chamber cut hearts are also showed (lower panel). Bars: 5 mm. (C) Significantly increased heart weight (upper graph) and heart/body weight ratio (lower graph) indicate cardiac hypertrophy in postnatal Tpr-Met mice (n = 6 animals per group). †p<0.005 vs control (two-tailed T-test). (D) Mean cross-sectional area (CSA) of ventricular cardiomyocytes is significantly higher in postnatal Tpr-Met compared to controls (left panel). n = 300 cells from 3 biological replicates per group. †p<0.005 vs control (two-tailed T-test). Distribution curves (right panel) of counted CSA show a shift to the right side in postnatal Tpr-Met mice as respect to controls. (E) Representative transversal sections of left ventricles show increased size in postnatal Tpr-Met cardiomyocytes. Left panels: laminin (red-surface). Right panels: quadruple overlay with laminin (red- surface), Griffonia (blue-endothelial), DAPI (white-nuclear) and GFP (green-intracellular). Bars: 35µm.

