Figure 4.

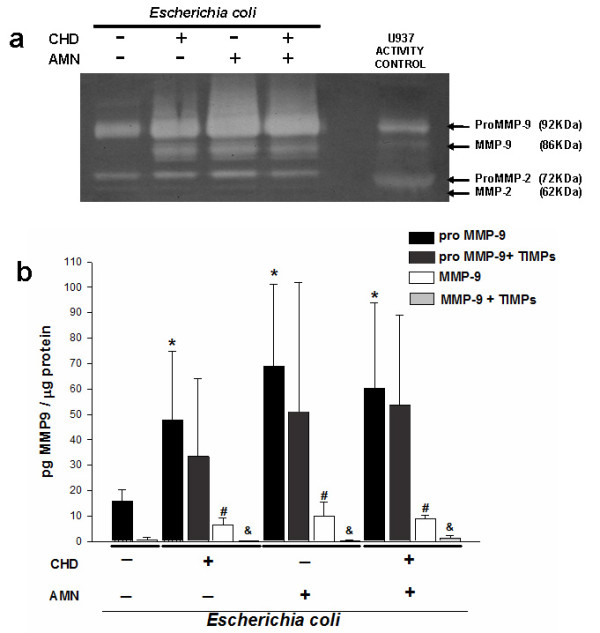
MMP-2 and MMP-9 associated to tissue. (a) Representative zymogram showing enzymatic activity of tissue extracts of membranes differentially stimulated with 1 × 10⁶ CFU of E. coli. Equal amounts of protein were loaded (6.0 μg). (b) Tissular content of zymogen and active form of MMP-9 after selective stimulation with the bacterium during 24 h. A group was included in which the membranes were incubated simultaneously with 500 ng/mL of TIMP1 and TIMP-2; proMMP-9 + TIMPs group was compared with its respective pro-MMP-9 group; on the other hand, MMP-9 + TIMPs group was compared with its respective MMP-9 group. The graphic data show the mean ± SD and * # &P < 0.05 was considered significant.
