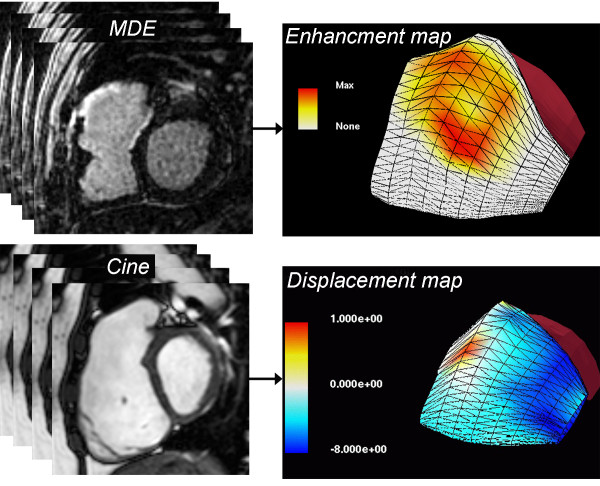
Figure 5.
Three-dimensional surface models of the right ventricular (RV) free wall reconstructed from multi-slice 2-dimensional short- and long-axis images. Top panel: Scar tissue map based on late gadolinium enhancement (LGE) imaging showing extensive late hyperenhancement of the RVOT (yellow and orange). Bottom panel: Displacement map based on multi-slice cine SSFP showing dyskinesis of the RVOT (red). See Wald et al. for further technical details [42].

