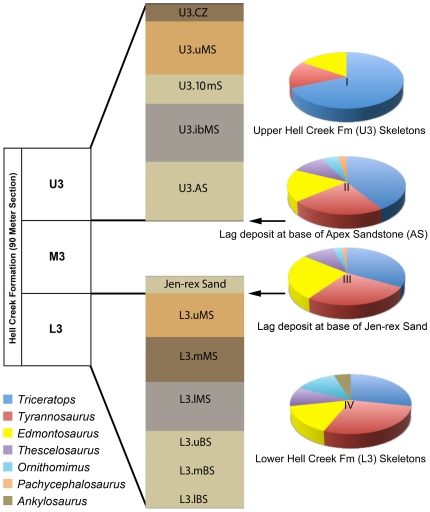
Figure 2. Stratigraphic divisions of the Hell Creek Formation with stratigraphic details of the upper third (U3) and lower third (L3) sequences referenced in the text and the associated pie chart showing dinosaur abundance.
Pie charts I – IV reflect the relative abundance of dinosaur genera based on skeletons (charts I and IV) and individual bones (charts II and III). Tyrannosaurus skeletons are as abundant as the hadrosaurid Edmontosaurus, an herbivore, in the upper Hell Creek Formation and nearly twice as common as Edmontosaurus in the lower Hell Creek Formation. Individual bones of Tyrannosaurus and Edmontosaurus are found approximately in the same order of magnitude within the lag deposits. Key: Pie chart I, dinosaur skeletons in the upper Hell Creek Formation (U3); Pie chart II, dinosaur bones from the “Doldrum’s” lag deposit at the base of the Apex Sandstone (AS); Pie chart III, dinosaur bones from the “3B-1” lag deposit at the base of the Jen-rex Sand; and Pie chart IV, dinosaur skeletons from the lower Hell Creek Formation (L3). Abbreviations: L3lBS, lower basal sandstone; L3.mBS, middle basal sandstone; L3.uBS, upper basal sandstone; L3.lMS, lower mudstone; L3.mMS, middle mudstone; L3.uMS, upper mudstone; U3.AS, Apex sandstone; U3.ibMS, interbedded mudstone; U3.10mS, 10 meter sandstone; U3.uMS, upper mudstone; U3.CZ, coal zone.

