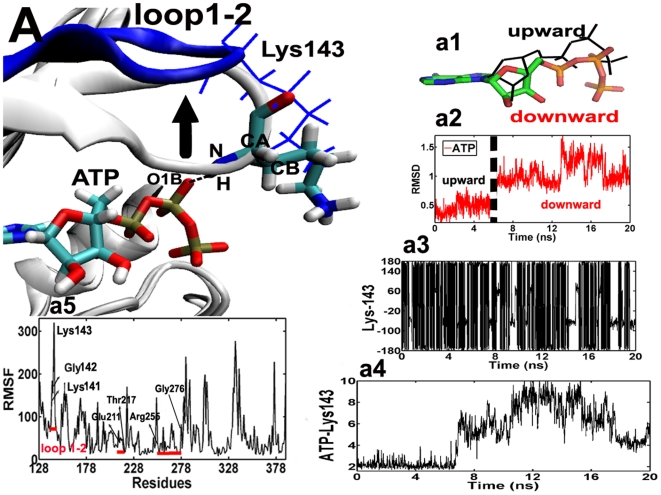
Figure 1. Superposition of the ATP binding sites for the typical snapshots of the Aurora–ATP simulation.
4.35 ns and 8.35 ns. For clarity, only the key region of loop 1–2 is colored in gray (4.35 ns) and blue (8.35 ns). Lys–143 at 4.35 ns is shown in blue line presentation, while residues and ADP at 8.35 ns are shown in stick presentations: cyan for carbon, white for hydrogen, red for oxygen, and blue for nitrogen atoms. As indicated by the black arrow, loop1–2 moves upward, accompanied by the formation and disruption of the hydrogen bond (the dashed line) between Lys–143 (H) and ATP (O1B) in an “open” state. (a1), superposition of ATP focusing on the different conformations of the triphosphate side chain (upward and downward states). (a2), time–dependence of RMSD of ATP. The dashed line depicts the upward and downward conformations of ATP. (a3), time–dependent rotation of Lys–143 about the (CB–CG–CD–CE) dihedral angle. (a4), time evolution of the distance between Lys–143 (H) and ATP (O1B). (a5), time evolution of the RMSF in the Aurora–ATP simulation. The red lines depict residues involved in the ATP binding site: Leu139–Arg–151, Glu–211–Thr–217 and Arg–255–Gly276. The result of the RMSF analysis indicates that in the binary simulation there are significant fluctuations centered around residues 141–143 (loop 1–2).

