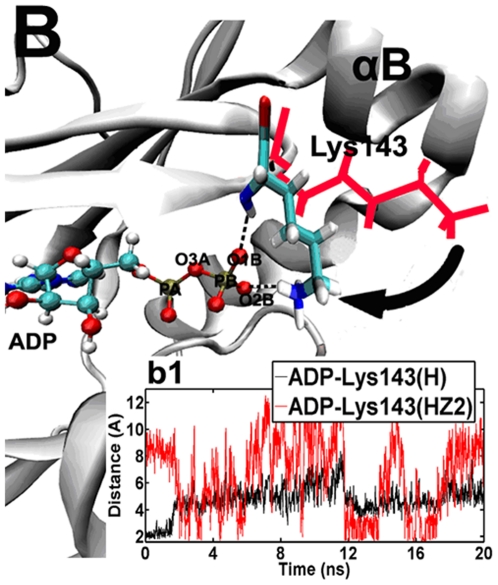
Figure 2. Superposition of the ATP binding sites for the typical snapshots of the Aurora–ADP simulation.
1.0 ns and 5.0 ns. For clarity, the key residue Lys–143 is shown in red line at 1.0 ns, while in sticks at 5.0 ns (cyan, carbon atoms; white, hydrogen atoms; blue, nitrogen atoms and red, oxygen atoms). After the first 1.6 ns, the hydrogen bond between Lys–143 (H) and ATP (O1B) is broken, but instead, the amino side chain of Lys–143 (HZ2) rotates to be contiguous to ATP, thus forming a new hydrogen bond (the dashed line) with the small molecular (O2B) in a “closed” state. The movement of Lys–143 is indicated by using the arrow. (b1), time evolutions of the distance between ADP (O1B) and Lys–143 (H and HZ2) in the Aurora–ADP simulation.

