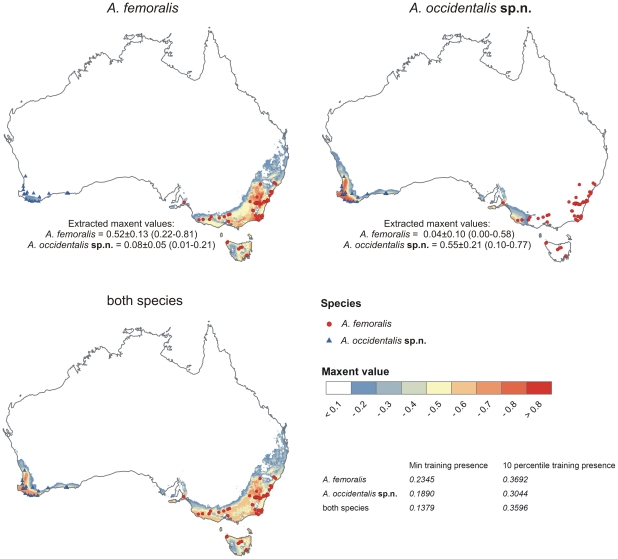
Figure 3. Ecological niche models.
Localities of Antiporus femoralis (blue triangles) and Antiporus occidentalis sp.n. (red circles), displayed on the backgrounds of Maxent-created ecological niche models. Higher Maxent values (yellow and red colours) represent areas more suitable for the species according to the Maxent models, lower values (green and blue or white colours) represent areas less suitable.

