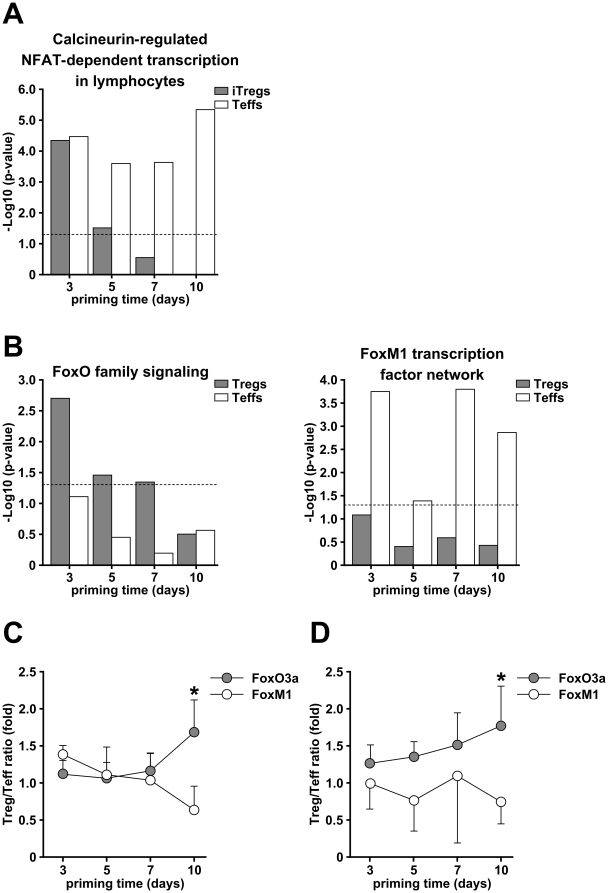
Figure 6. Pathways characteristic for developing iTregs or Teffs.
(A, B) Significance score (-log10 p value) of three pathways characteristic for iTregs or Teffs development, “calcineurin-regulated NFAT-dependent transcription in lymphocytes” (A), “FoxO family signaling” and “FoxM1 transcription network” (B) during the 10 days of culture. Grey bars indicate significance scores in iTregs, white bars in Teffs. (C, D) Relative expression of the transcription factors FoxO3a and FoxM1 as a ratio of their mRNA expression levels in iTregs to those in Teffs at each respective time point determined by microarray (C) and by real-time PCR (D). Data are shown as mean ± SD from three (C) and five (D) experiments. * p<0.05.

