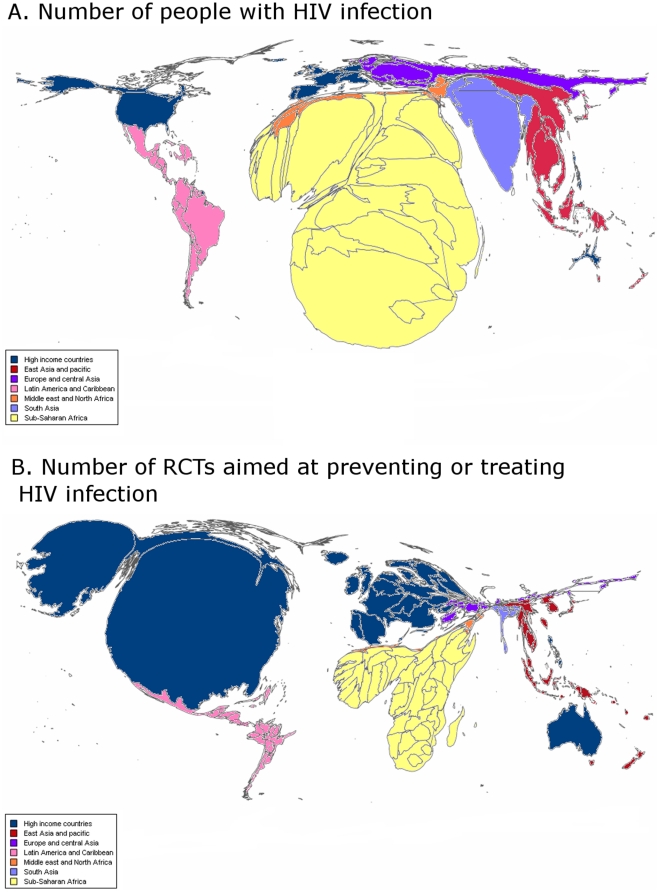
Figure 5. Area cartograms showing the sizes of countries in proportion to A) the number of people with HIV infection* and B) the number of RCTs (primary and ongoing RCTs) aimed at treating or preventing HIV infection†.
*Source: report on the global AIDS epidemic, UNAIDS/WHO, July 2008. †The number of RCTs (primary and ongoing) was classified by main regions according to the 2008 World Bank classification: high-income countries, East Asia and Pacific, Eastern Europe and Central Asia, Latin America and Caribbean, Middle East and North Africa, South Asia, Sub-Saharan Africa. For the construction of the map we divided the number of trials performed in each region by the number of countries in each region.

