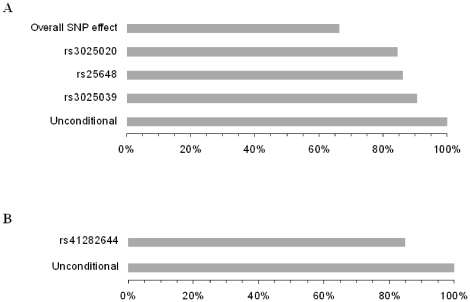
Figure 2. Graphical representation of the proportion of linkage explained by the SNP in Campora (A) and Cardile (B).
The percentages reported correspond to the mean LOD score over all sub-pedigree sets analyzed conditional on SNP genotypes divided by the mean LOD score over all sub-pedigree sets analyzed unconditionally. A decrease of the linkage peak is observed after adjusting for the genotypes at each associated SNP. A greater effect is observed when the three SNPs detected in Campora are considered simultaneously.

