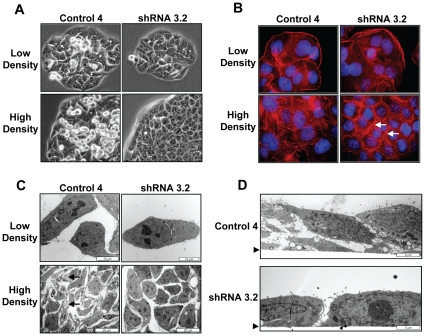
Figure 2. The effects of NAT1 knock-down on cell morphology.
(A) Light microscopy of control (Control 4) and knock-down (shRNA 3.2) cells at low density (upper panels) and high density (lower panels). (B) Confocal microscopy of actin polymerization in cells at low (upper panels) and high (lower panels) density. Actin was stained with Alexa Fluor 647 conjugated phalloidin (red) and the cell nuclei were stained with DAPI (blue). White arrows show sub-cortical actin associated with sites of cell-cell contact (lower right panel). (C) Transmission electron microscopy of control and NAT1 knock-down cells at low and high density. Black arrows show vacuoles. (D) Longitudinal sections of control and NAT1 knock-down cells by transmission electron microscopy at high density. Arrowheads indicate the bottom of the culture flask.

