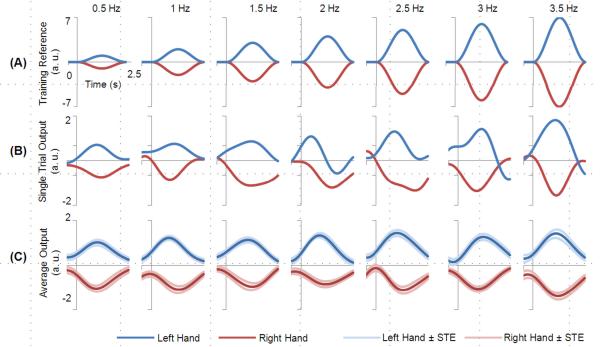
Figure 5.
Decoding of the hand and speed from a typical subject. Blue and red curves indicate the imagination of the left and right hand, respectively. (A) shows the computer-generated reference time course used for training. (B) shows single-trial traces of decoded outputs for all speeds. (C) plots the averaged outputs of the test dataset according to their speed and hand. The curves in lighter red and blues color indicate the standard errors (STE).

