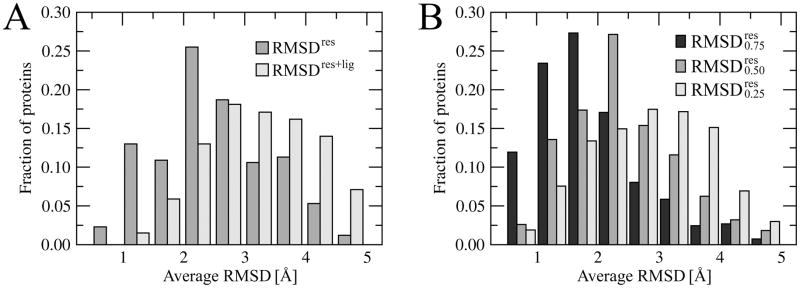
Figure 1.
Histogram of the average RMSD for similar binding sites extracted from weakly related proteins. A – RMSD calculated over protein (RMSDres) as well as protein and ligand heavy atoms (RMSDres+lig). B – RMSDres for strongly (0.75), moderately (0.50) and weakly (0.25) conserved binding residues.

