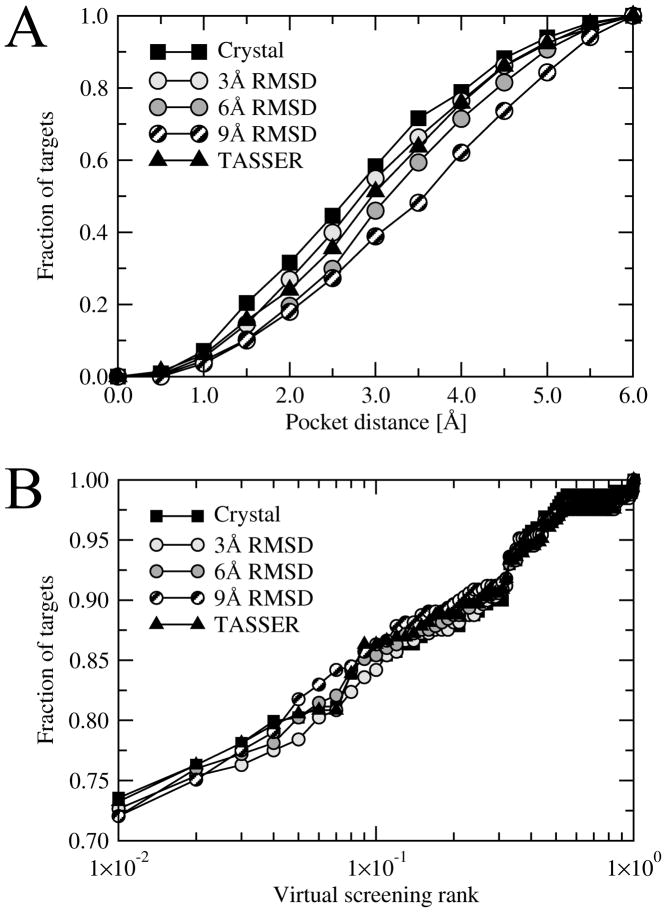
Figure 2.
Accuracy of ligand binding site prediction by FINDSITE (A) and ligand-based virtual screening (B). A – the cumulative fraction of proteins with a distance between the center of mass of a ligand in the native complex and the center of the best of top five predicted binding sites displayed on the x-axis. B – the cumulative fraction of proteins, whose native ligand was ranked within the fraction of the screening library displayed on the x-axis.

