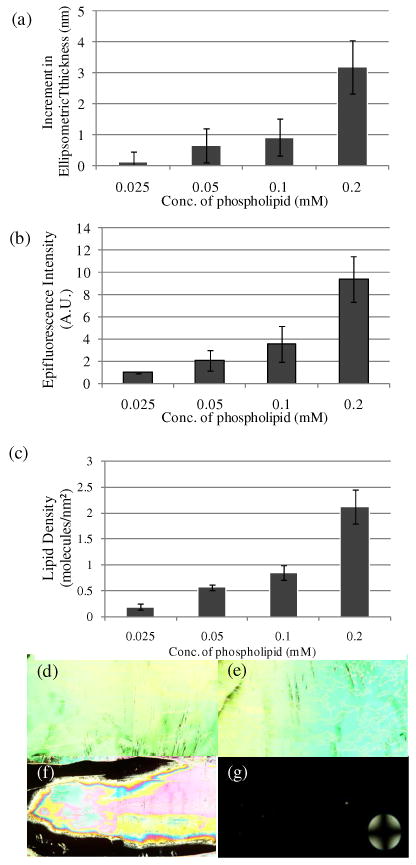
Figure 5.

(a) Increment in optical thickness following incubation of biotinylated vesicles on avidin-functionalized surfaces, as a function of total phospholipid concentration in solution (1 mol % biotin-DOPE). (b) Plot of epifluorescence intensity of surfaces measured following incubation in various concentrations of biotinylated vesicles. (c) Plot of lipid density on the surfaces measured following incubation in various concentrations of biotinylated vesicles. Optical images (crossed polars) of nematic 5CB sandwiched in optical cells with surfaces incubated with biotinylated vesicle solutions with total lipid concentrations of (d) 0.025 mM, (e) 0.05 mM, (f) 0.1 mM and (g) 0.2 mM. The error bars represent one standard deviation. (N=4)
