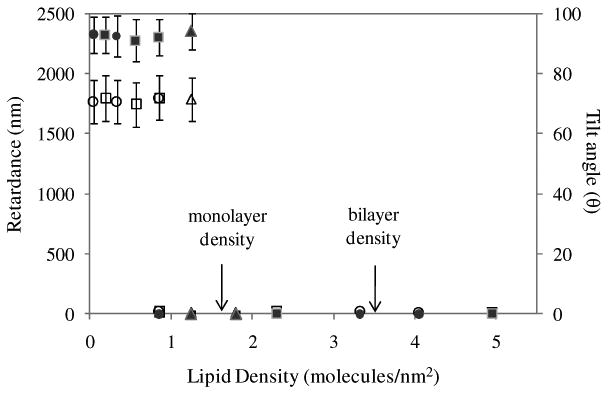
Figure 7.

Plot of optical retardance of nematic films of 5CB (solid symbols) and tilt angle of 5CB (hollow symbols) at the avidin-functionalized surface on which vesicles were incubated versus density of phospholipid captured on the surface. Squares represent data obtained from surfaces incubated with varying total phospholipid concentration (1 mol % biotinylated lipid); Circles represent data obtained by varying mole fraction of biotinylated lipid (total concentration of phospholipid of 0.1 mM); Triangles represent data obtained by varying the time of incubation of the vesicles in solution (see Figure S8). The error bars represent one standard deviation.
