
Figure 3.
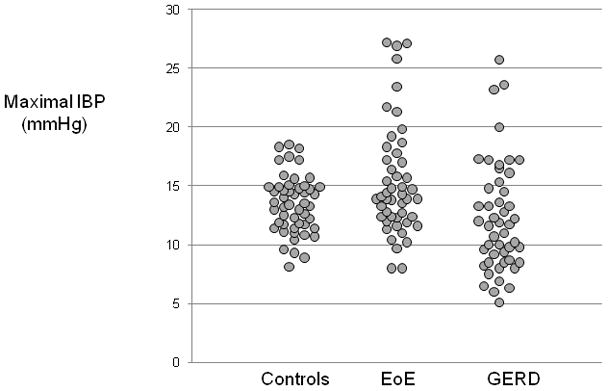
Distribution of the maximal IBP among the controls, EoE and GERD patients. The distribution was significantly different between controls and GERD (p=0.02) and between EoE and GERD (p=0.01), but not between controls and EoE (p=0.1).
Official websites use .gov
A
.gov website belongs to an official
government organization in the United States.
Secure .gov websites use HTTPS
A lock (
) or https:// means you've safely
connected to the .gov website. Share sensitive
information only on official, secure websites.
Distribution of the maximal IBP among the controls, EoE and GERD patients. The distribution was significantly different between controls and GERD (p=0.02) and between EoE and GERD (p=0.01), but not between controls and EoE (p=0.1).