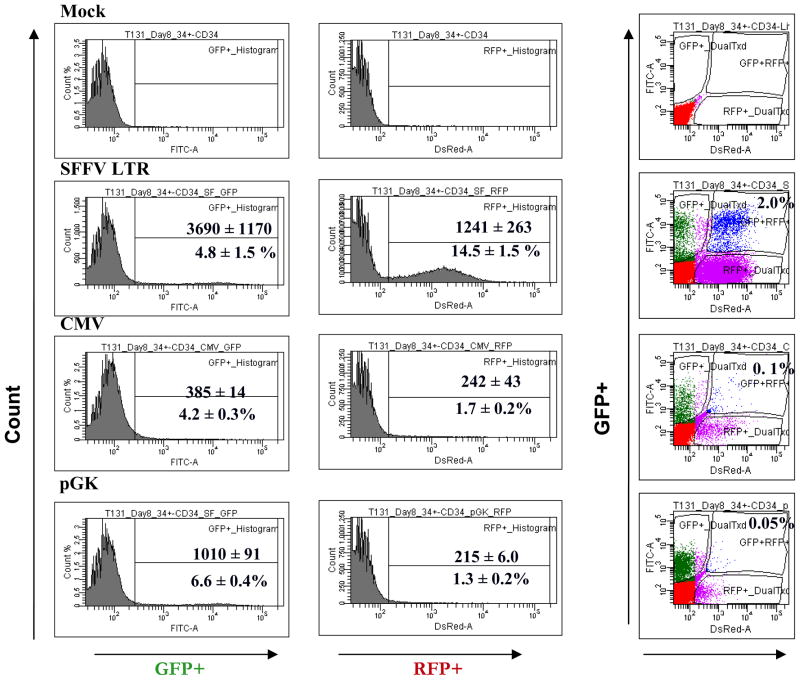
Figure 1. Transfer and expression of GFP and RFP gene in human CD34+ cells.
CD34+ cells were transduced with the indicated vectors at an MOI of 5 and analyzed by flow cytometry for GFP+, RFP+ and GFP+/RFP+ expression. A) Histograms of GFP fluorescent intensity and RFP fluorescent intensity. The upper number represents the median fluorescent intensity while the lower number represents the percentage of positive cells. B) Representative flow cytometry plot of GFP+ versus RFP+ cells.

