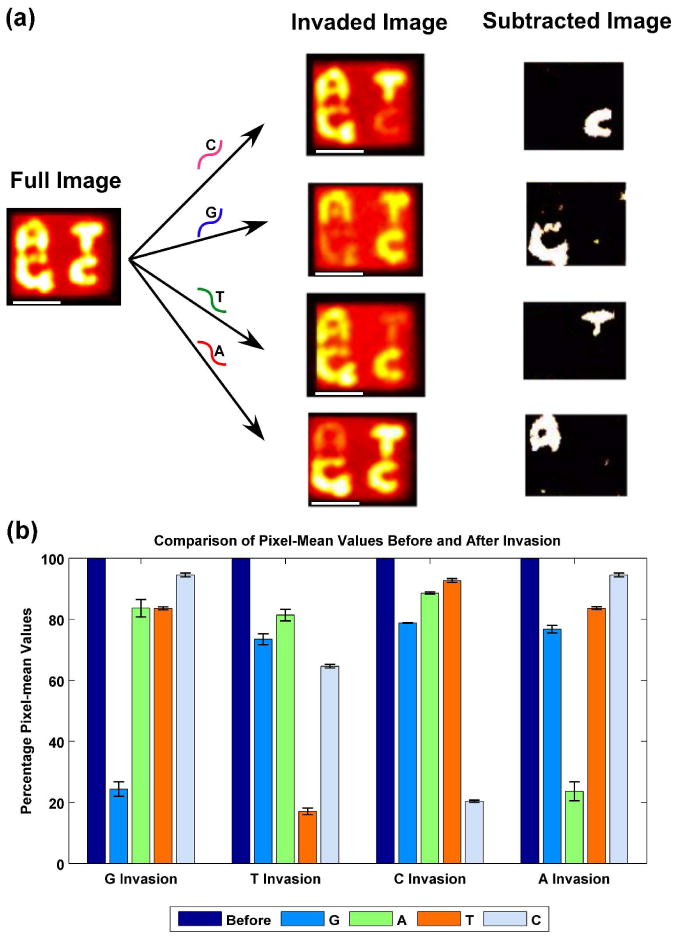
Figure 4.

(a) Operation of the System. The ‘Full Image’ shown at the left of the panel shows an AFM image of the DNA origami tile before any invasion has taken place; 25 separate images are averaged. The four ‘Invaded Image’ rectangles correspond to the averaging of 25 separate AFM images, and the identity of the key nucleotide in the invasive strand is indicated over the arrow. The white scale bars represent a distance of 50 nm. It is clear from these images that the correct letter has been removed in each case. The ‘Subtracted Image’ on the right highlights the identity of the nucleotide. (b) Robustness of the Assay For each character, normalized to 100%, the mean value of the sum of the pixels around the letters are shown for invasion by the target nucleotide and for the others. Error bars are indicated for each of the measurements. In each case, the average of the pixel intensities is about 20-25% for the target nucleotide, and ranges from >60% to >90% for the other nucleotides.
