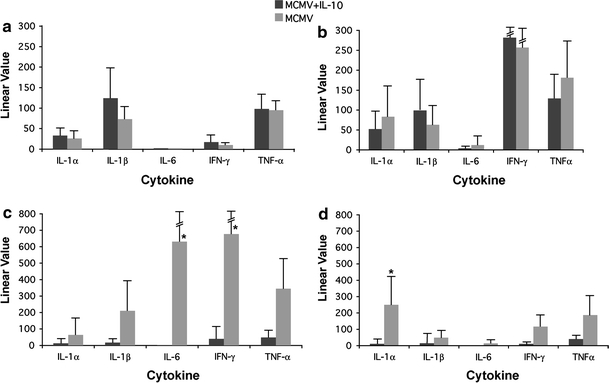
Fig. 2.

Cytokine transcription in spleens of treated and untreated MCMV-infected IL-10 KO mice at a 1 day post-infection; b 3 days post-infection; c 5 days post-infection; d 8 days post-infection. Data represent average of 8 mice per time point. Linear value = linear value in infected − linear value in uninfected control mice; *statistically significant difference between treated versus untreated mice represented as p ≤ 0.05 (Wilcoxon rank sum test)
