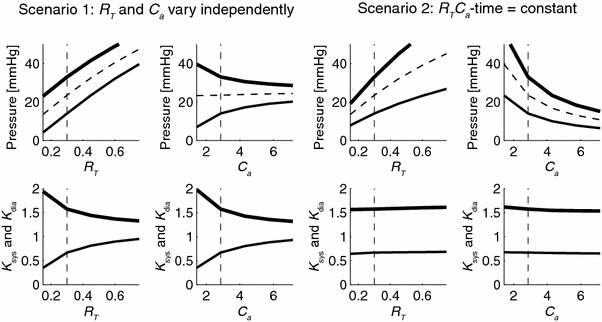
Figure 3.

Sensitivity analysis of isolated changes of arterial parameters to P sys, P dia and P mean (upper panels), and to K sys = P sys/P mean and K dia = P dia/P mean (lower panels). The left four panels show results when total arterial resistance, R T, or arterial compliance, C a, is varied (scenario 1); the right four panels show the results when RC-time set constant in the model, i.e. an increase in R T is accompanied by a proportional decrease in C a (scenario 2). For all simulations, model parameters from Group 1 in Table 1 were used, with baseline values represented by the vertical dashed lines. Systole is indicated by thick lines, diastole by thin lines, and mean pressure by dashed lines. The analysis shows that the ratios K sys and K dia are constant when RC-time is constant (bottom panels scenario 2)
