
Figure 4.
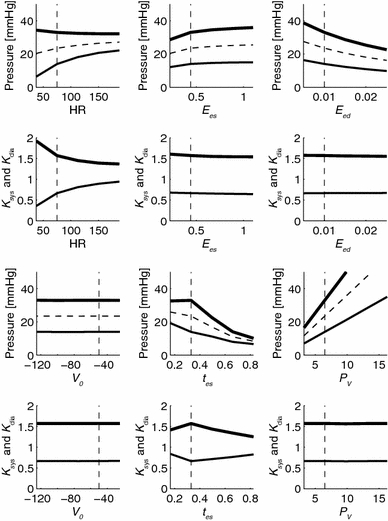
Sensitivity analysis of isolated changes of ventricular parameters on P sys, P dia and P mean (upper panels), and to K sys = P sys/P mean and K dia = P dia/P mean (lower panels). Results are shown for varying heart rate (HR), end-systolic and end-diastolic ventricular elastance (E es and E ed), intercept volume (V 0), time to reach end-systole (t es) and venous filling pressure (P v). For all simulations model parameters from group 1 in table 1 were used. Systole is indicated by thick lines, diastole by thin lines, and mean pressure by dashed lines