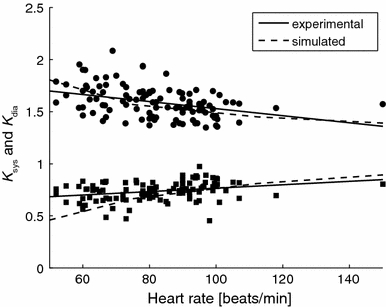
Figure 5.

Effect of heart rate (HR) on pressure ratios K sys (dots) and K dia (squares) in the control subjects (group 1) and PAH patients (group 2a + 2b). Although regression analysis did not reveal significant relations, an increase in heart rate shows a trend towards increasing K sys and decreasing K dia (thin lines). The experimental data and the simulated data show similar trends (dotted lines as in Fig. 4)
